While this election season has a particular candidate caricaturing himself as a "law and order" candidate, violence and crime are far from what ails this country. Most reports show that crime is down across the U.S., and while police deaths (and really all deaths) are tragedies in their own right, this issue has been largely exaggerated. These are certainly important problems, but many of the issues that impact the majority of Americans are economic and social in nature.
Regarding the economic problems, household income is a particularly important issue. So, in continuation with the theme of my last post, I'd like to present some of my findings from an analysis I did of the factors associated with variation in median household income in 229 U.S. metropolitan areas. I'll try to give the least technical presentation that I can of the data as I discuss my findings.
***A quick disclaimer on causation: Statistical models are amazing tools, but it's often the responsibility of researchers and their audience to make informed decisions about what the results from statistical analysis mean. Facts and data don't speak for themselves, so don't take my presentation/interpretation of my results as gospel truth.

If we compare these numbers with those observed in 1999, we can see that in the period leading up to 2014, median household income took a bit of a beating. In 1999 the median household income ranged from as low as $40,020 (higher than the low in 2014) to as high as $91,700 (also higher than the high in 2014), meanwhile, the median value was $68,390.
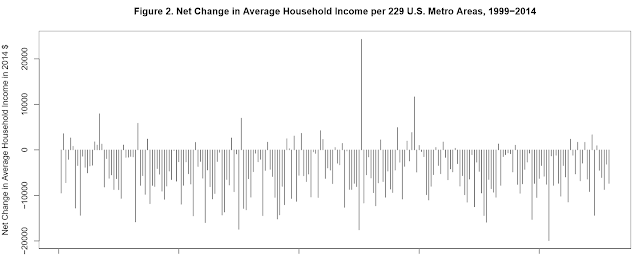
Figure 2 shows, clearly, that the observed decline in household income was a fairly widespread phenomenon across U.S. metros. While there was quite the spike in the median household income in Midland, TX, ($24,310), the median household income declined by $5,202 on average. The most extreme decline was observed in Springfield, OH, where the median household income decreased by as much as $19,940.
Also (and this result is interesting) more people per metro with only an associate's degree was negatively associated with median household income. According my model, holding all other covariates constant a 1 unit increase in the natural log of the population aged 25+ per metro whose highest level of educational attainment was an associate's degree would result in a decline in the median household income to the tune of $10,048.37.
However, more people with some college under their belt (but no college degree) was moderately associated (this just means the result isn't quite special enough to earn a '*', but it comes close) with a larger median household income. 1 unit increase in the natural log of the population aged 25+ with only some college, according to this model, should result in a $8,352.51 increase in the median household income per metro.
Turning to the effects of field of study, my model shows a significant positive relationship between the number of people whose first degree was in the social sciences, business, or engineering and median household income per metro. Holding everything else constant, this model predicts that a 1 unit increase in the natural log of the population aged 25+ whose first degree was in these fields should result in a $4,606.91, $2,457.10, and $5,356.07 increase, respectively, in the median household income per metro region.
On the negative side, more people per metro whose first degree was in the fields of education, literature, and the visual and performing arts was associated with a lower median household income. More specifically, my model suggests that a 1 unit increase in the natural log of the population aged 25+ whose first degree was in these fields should result in a $4,756.32, $3,463.93, and $3,124.12 decline, respective, in median household income per metro.
Between the share of GDP coming from government services and private services, only the former approached significance in its effect on median household income. My model suggests that a 1 unit increase in the share of GDP from government services should result in $134.98 decline in median household income. However, this result, again, is only moderately significant. Moreover, an almost $135 decline in household income is not terribly substantial.
'Till next time, Cheers!
***Data Sources: Data used for this post were drawn from the following sites:
http://www.pewsocialtrends.org/files/2016/05/Middle-Class-U.S.-Metro-Areas-5-12-16-Supplementary-Tables.xlsx
http://factfinder.census.gov/faces/nav/jsf/pages/searchresults.xhtml?refresh=t
Regarding the economic problems, household income is a particularly important issue. So, in continuation with the theme of my last post, I'd like to present some of my findings from an analysis I did of the factors associated with variation in median household income in 229 U.S. metropolitan areas. I'll try to give the least technical presentation that I can of the data as I discuss my findings.
***A quick disclaimer on causation: Statistical models are amazing tools, but it's often the responsibility of researchers and their audience to make informed decisions about what the results from statistical analysis mean. Facts and data don't speak for themselves, so don't take my presentation/interpretation of my results as gospel truth.
What Effects Household Income?
Variation in Average Household Income
Median household income significantly varies across America's metropolitan regions. As Figure 1 shows, in 2014 the overall median household income ranged from as low as $39,750 to as high as $90,740, while the median value came in at $62,720.
If we compare these numbers with those observed in 1999, we can see that in the period leading up to 2014, median household income took a bit of a beating. In 1999 the median household income ranged from as low as $40,020 (higher than the low in 2014) to as high as $91,700 (also higher than the high in 2014), meanwhile, the median value was $68,390.
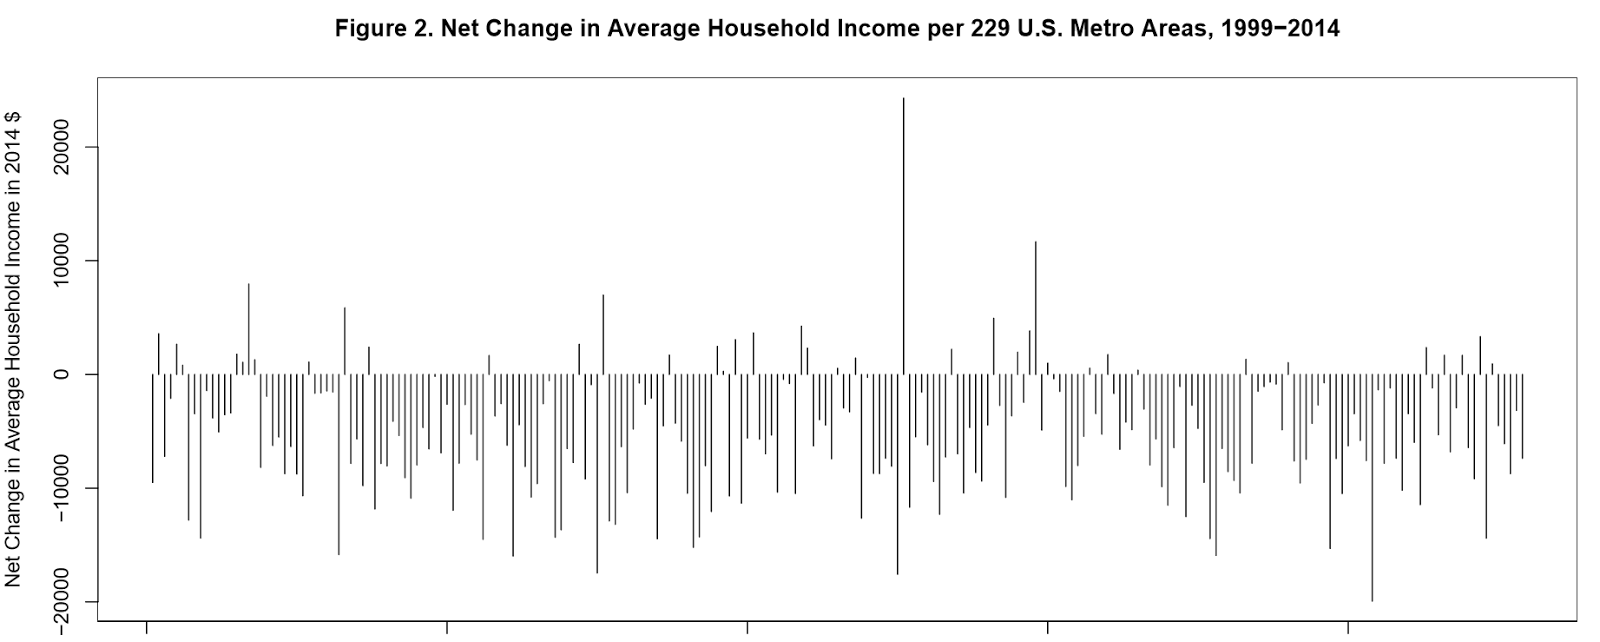
Figure 2 shows, clearly, that the observed decline in household income was a fairly widespread phenomenon across U.S. metros. While there was quite the spike in the median household income in Midland, TX, ($24,310), the median household income declined by $5,202 on average. The most extreme decline was observed in Springfield, OH, where the median household income decreased by as much as $19,940.
Factors Associated with Variation in Household Income
It's pretty clear that the median household income not only declined between 1999 and 2014, median income varied significantly across metros in 2014. What explains this variation? According to the results from the ordinary least squares (OLS) regression model displayed below, a number of factors per metro region had a statistically significant (denoted by '*'s) effect on median household income. Moreover, these factors in combination were able to explain about 64% of the variance in median household income per metro area. |
| Table 1. OLS Model Summary |
The Effect of Educational Attainment and Field of Study
Regarding educational attainment, more people per metro with only some high school education under their belt was negatively associated with median household income. More specifically, the results suggest that a 1 unit increase in the natural log of the population aged 25+ per metro area whose highest level of education was some high school would result in an average decline in median household income by $6,999.71, all else equal.Also (and this result is interesting) more people per metro with only an associate's degree was negatively associated with median household income. According my model, holding all other covariates constant a 1 unit increase in the natural log of the population aged 25+ per metro whose highest level of educational attainment was an associate's degree would result in a decline in the median household income to the tune of $10,048.37.
However, more people with some college under their belt (but no college degree) was moderately associated (this just means the result isn't quite special enough to earn a '*', but it comes close) with a larger median household income. 1 unit increase in the natural log of the population aged 25+ with only some college, according to this model, should result in a $8,352.51 increase in the median household income per metro.
Turning to the effects of field of study, my model shows a significant positive relationship between the number of people whose first degree was in the social sciences, business, or engineering and median household income per metro. Holding everything else constant, this model predicts that a 1 unit increase in the natural log of the population aged 25+ whose first degree was in these fields should result in a $4,606.91, $2,457.10, and $5,356.07 increase, respectively, in the median household income per metro region.
On the negative side, more people per metro whose first degree was in the fields of education, literature, and the visual and performing arts was associated with a lower median household income. More specifically, my model suggests that a 1 unit increase in the natural log of the population aged 25+ whose first degree was in these fields should result in a $4,756.32, $3,463.93, and $3,124.12 decline, respective, in median household income per metro.
The Effect of Unemployment
It should come as little surprise that higher rates of unemployment have a negative effect on median household income (duh!). A 1 unit increase in the unemployment rate, according to my model, should result in a $526.62 decrease in median household income per metro.The Effect of the Share of GDP from Manufacturing, Government Services, and Private Services
Vis-à-vis the significance often given to the manufacturing sector by the media and politicians, according to my model manufacturing didn't have a significant effect on median household income, at least in 2014. This finding may suggest manufacturing's effect is overstated, or this finding may simply be due to the way I measured the manufacturing sector: e.g., as the share of GDP per metro area coming from manufacturing. This measure neither measures employment associated with manufacturing nor the type(s) of manufacturing present in each metro area. So, before you take this result to mean manufacturing isn't important, take into consideration the limitations of my model.Between the share of GDP coming from government services and private services, only the former approached significance in its effect on median household income. My model suggests that a 1 unit increase in the share of GDP from government services should result in $134.98 decline in median household income. However, this result, again, is only moderately significant. Moreover, an almost $135 decline in household income is not terribly substantial.
The Effect of Demographic Factors
Among the variables included in my model that capture demographic factors--the share of the population identifying as minority (not white only), African American, and Hispanic per metro--only the share of the population that identified as Hispanic had a significant effect on median household income. However the relationship between the size of the Hispanic population and median household income, though negative, was not substantial. According to my model, a 1 unit increase in the share of the population identifying as Hispanic would result in a $193.48 decline in median household income per metro.The Effect of U.S. Statistical Regions
Regarding regional effects, among the U.S. statistical regions (as defined by the U.S. Census Bureau) included in my analysis, only metros in the Middle Atlantic and New England were associated with a higher median household income ($6,159.42 to be exact).Discussion and Conclusion
Why Care?
What's the big takeaway here? If you take these findings in combination with the results from my latest graduate paper ("The Incredible Shrinking Middle Class"), focusing on improving educational outcomes seems worthy of our attention. The most salient insights from my analysis are as follows:- Fewer people with only some high school education may lead to an increase in median household income. Therefore, more needs to be done (if nothing is already being done) to improve high school completion rates.
- Also, while my model doesn't really suggest that more people with bachelor's degrees or graduate degrees has a significant correlation with median household income, my other research shows that more people with graduate degrees is associated with a larger upper class. Therefore, investing in higher education may be beneficial.
- Furthermore, the negative effect of more people with associate's degrees seems to go hand in hand with my other research that showed a negative correlation between more people with associate's degrees and the size of the upper class and a positive (though only moderately significant) correlation between more people with associate's degrees and the size of the lower class. While it's unclear based on my model why this negative correlation between more people with associate's degrees and income is observed, it may suggest that we aren't doing enough to make sure those earning associate's degrees are well placed for employment in higher paying jobs upon graduation.
How to Improve this Analysis
For my next post, I'll look more closely at the effect of the factors included in the above model on the median household income per metro region by income tier (e.g., the lower, middle, and upper income-tier categories). These results may offer a clearer picture of the varying effects of education, unemployment, sources of GDP, demographic factors, and statistical regions on incomes for individuals in the lower, middle, and upper class.'Till next time, Cheers!
***Data Sources: Data used for this post were drawn from the following sites:
http://www.pewsocialtrends.org/files/2016/05/Middle-Class-U.S.-Metro-Areas-5-12-16-Supplementary-Tables.xlsx
http://factfinder.census.gov/faces/nav/jsf/pages/searchresults.xhtml?refresh=t
Comments
Post a Comment